A Basic Guide to ECG/EKG Interpretation
An ECG/EKG is a tracing of the electrical activity of the heart. In this blog post we’ll take a basic look at the components of an ECG trace.
The diagram below shows a the trace generated by one heart beat. But what does each component represent?
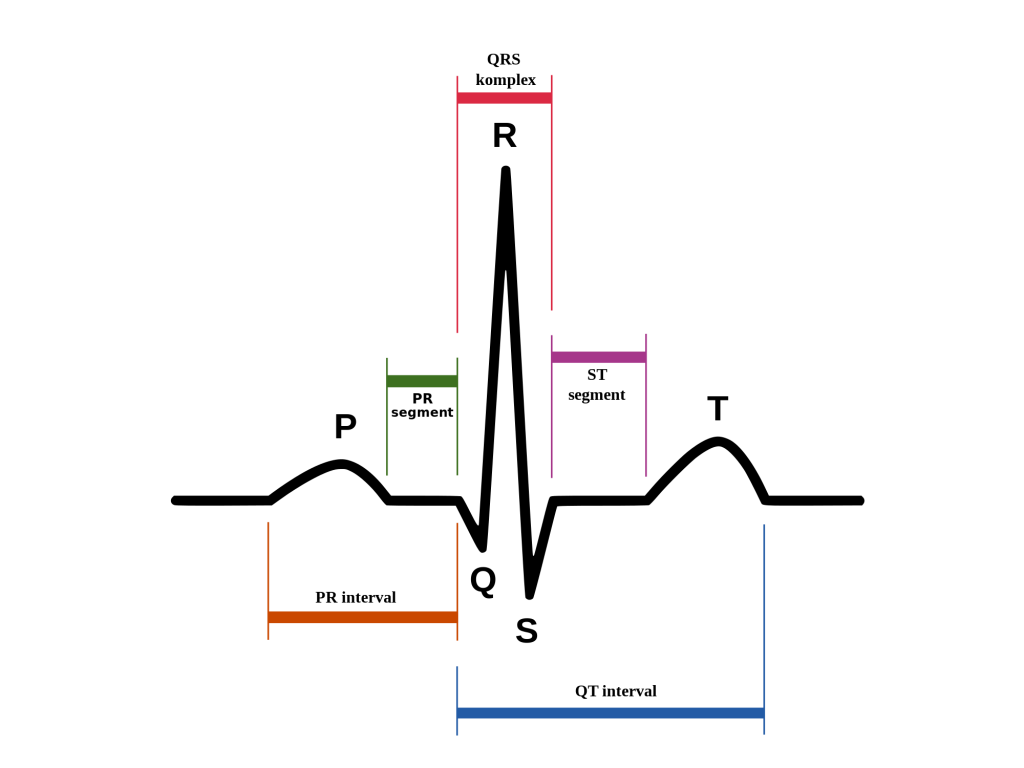
The P Wave
The first wave (p wave) represents atrial depolarisation. When the valves between the atria and ventricles open, 70% of the blood in the atria falls through with the aid of gravity, but mainly due to suction caused by the ventricles as they expand.
Atrial contraction is required only for the final 30% and therefore a relatively small muscle mass is required and only a relatively small amount of voltage is needed to contract the atria.
The Q Wave
There is a small negative wave immediately before the large QRS complex. This is known as a Q wave and represents depolarisation in the septum.
Whilst the electrical stimulus passes through the bundle of His, and before it separates down the two bundle branches, it starts to depolarise the septum from left to right. This is only a small amount of conduction (hence the Q wave is less than 2 small squares), and it travels in the opposite direction to the main conduction (right to left) so the Q wave points in the opposite direction to the large QRS complex.
The R Wave
The QRS complex is made up of three waves. These waves indicate the changing direction of the electrical stimulus as it passes through the heart’s conduction system.
The largest wave in the QRS complex is the R wave.
As you can see from the diagram, the R wave represents the electrical stimulus as it passes through the main portion of the ventricular walls. The wall of the ventricles are very thick due to the amount of work they have to do and, consequently, more voltage is required.
This is why the R wave is by far the biggest wave generated during normal conduction.
More muscle means more cells. More cells means more electricity. More electricity leads to a bigger wave.
The S Wave
You will also have seen a small negative wave following the large R wave. This is known as an S wave and represents depolarisation in the Purkinje fibres.
The S wave travels in the opposite direction to the large R wave because, as can be seen on the earlier picture, the Purkinje fibres spread throughout the ventricles from top to bottom and then back up through the walls of the ventricles.
The T Wave
Both ventricles repolarise before the cycle repeats itself and therefore a 3rd wave (T wave) is visible representing ventricular repolarisation.
The ST Segment
There is a brief period between the end of the QRS complex and the beginning of the T wave where there is no conduction and the line is flat. This is known as the ST segment and it is a key indicator for both myocardial ischemia and necrosis if it goes up or down.
The U Wave
Finally, it is possible to see another wave after the PQRST complex. This is known as a U wave. It is not very common and is easy to overlook.
In a normal heart beat, the T wave represents repolarisation of the ventricles, specifically the repolarisation of the AV node and bundle branches. The U wave occurs when the ECG/EKG machine picks up repolarisation of the Purkinje fibres.